The easiest way to check out data from the RikiDolphin database is to download the file and open it with SQLite Browser.
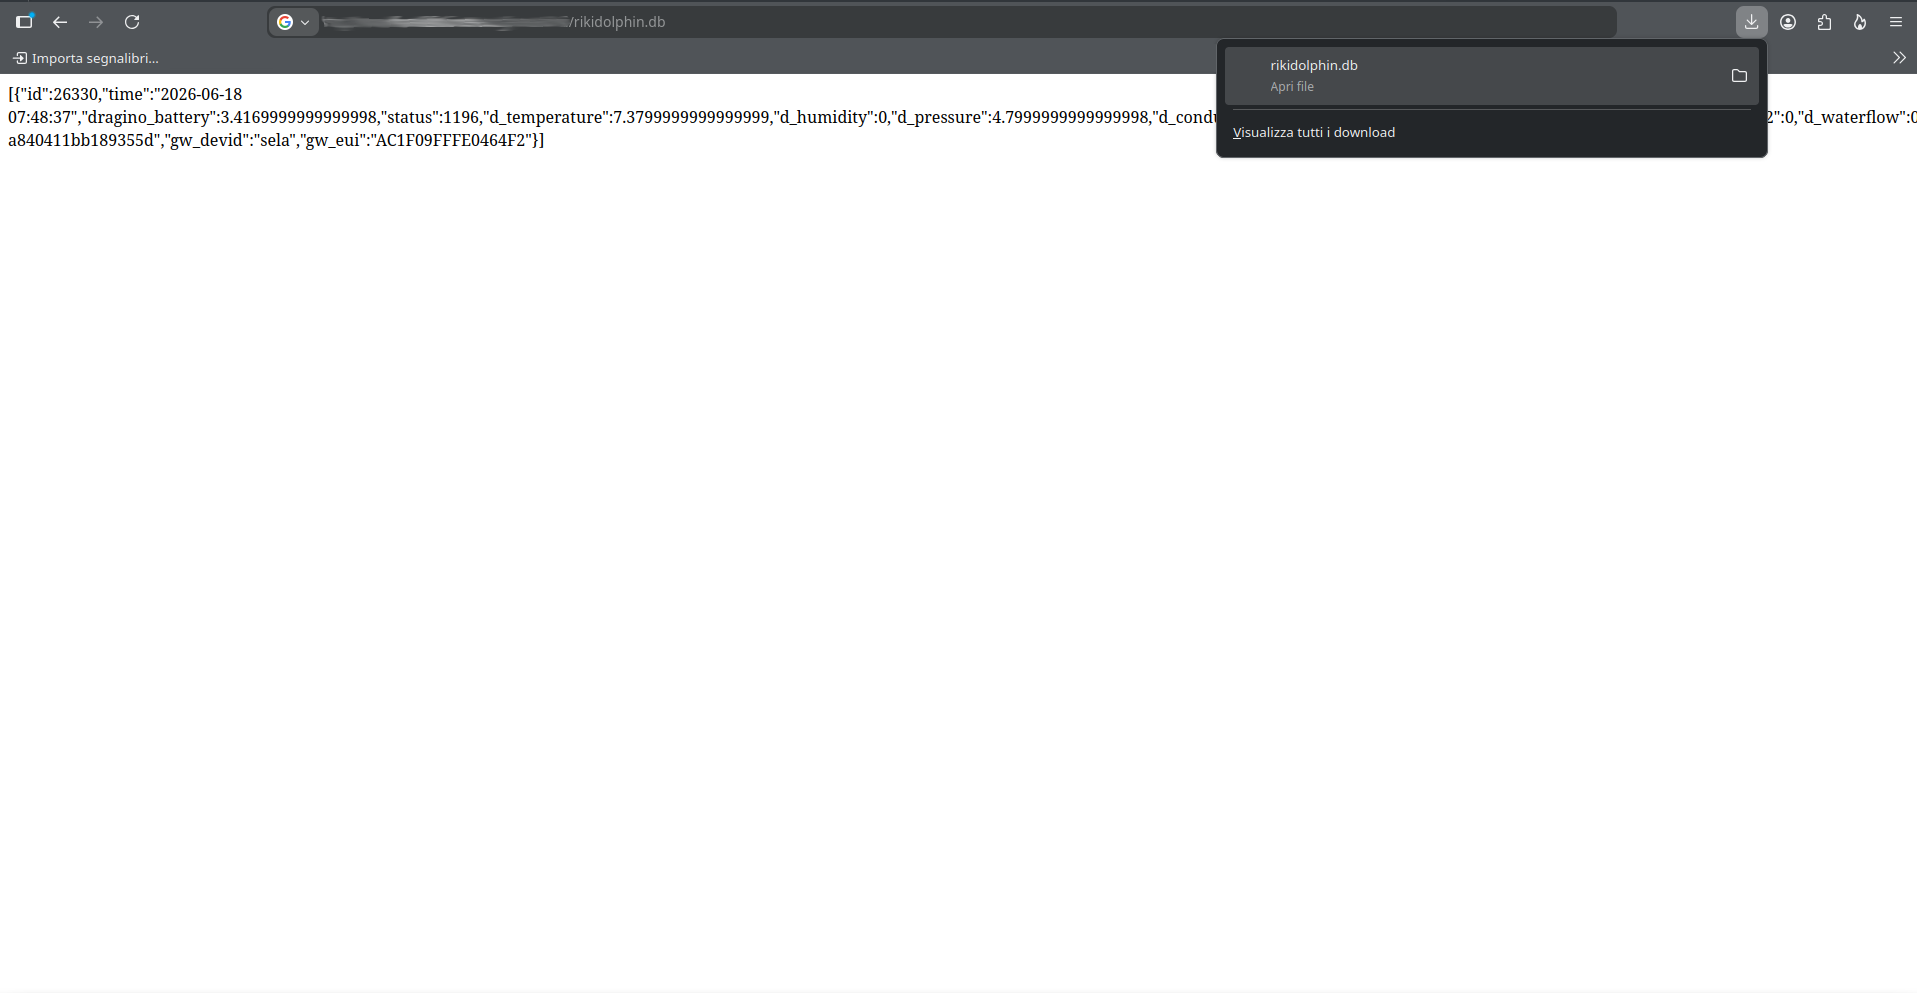
The file is called rikidolphin.db, and it can be found in the same folder of the webhook.php script. It can be downloaded just by entering its full URL in a web browser.
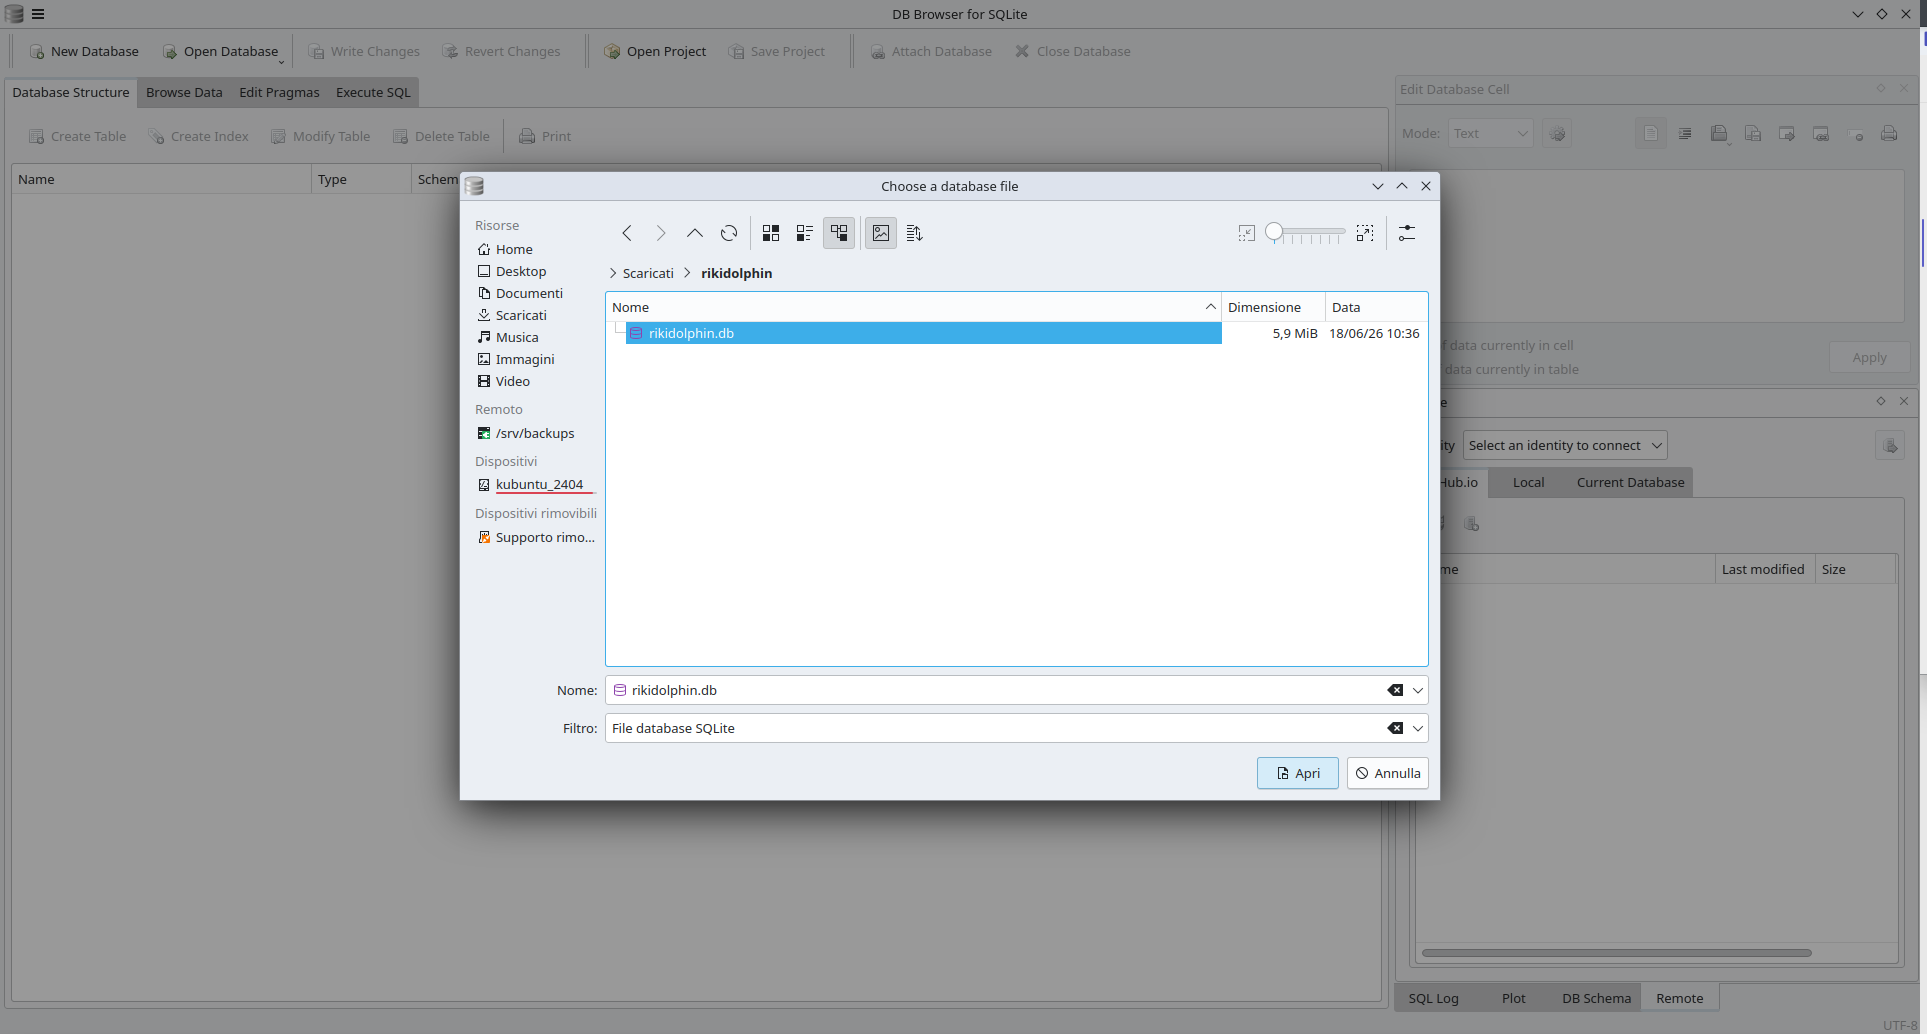
The database file can then be opened with SQLite Browser using the Open Database button.
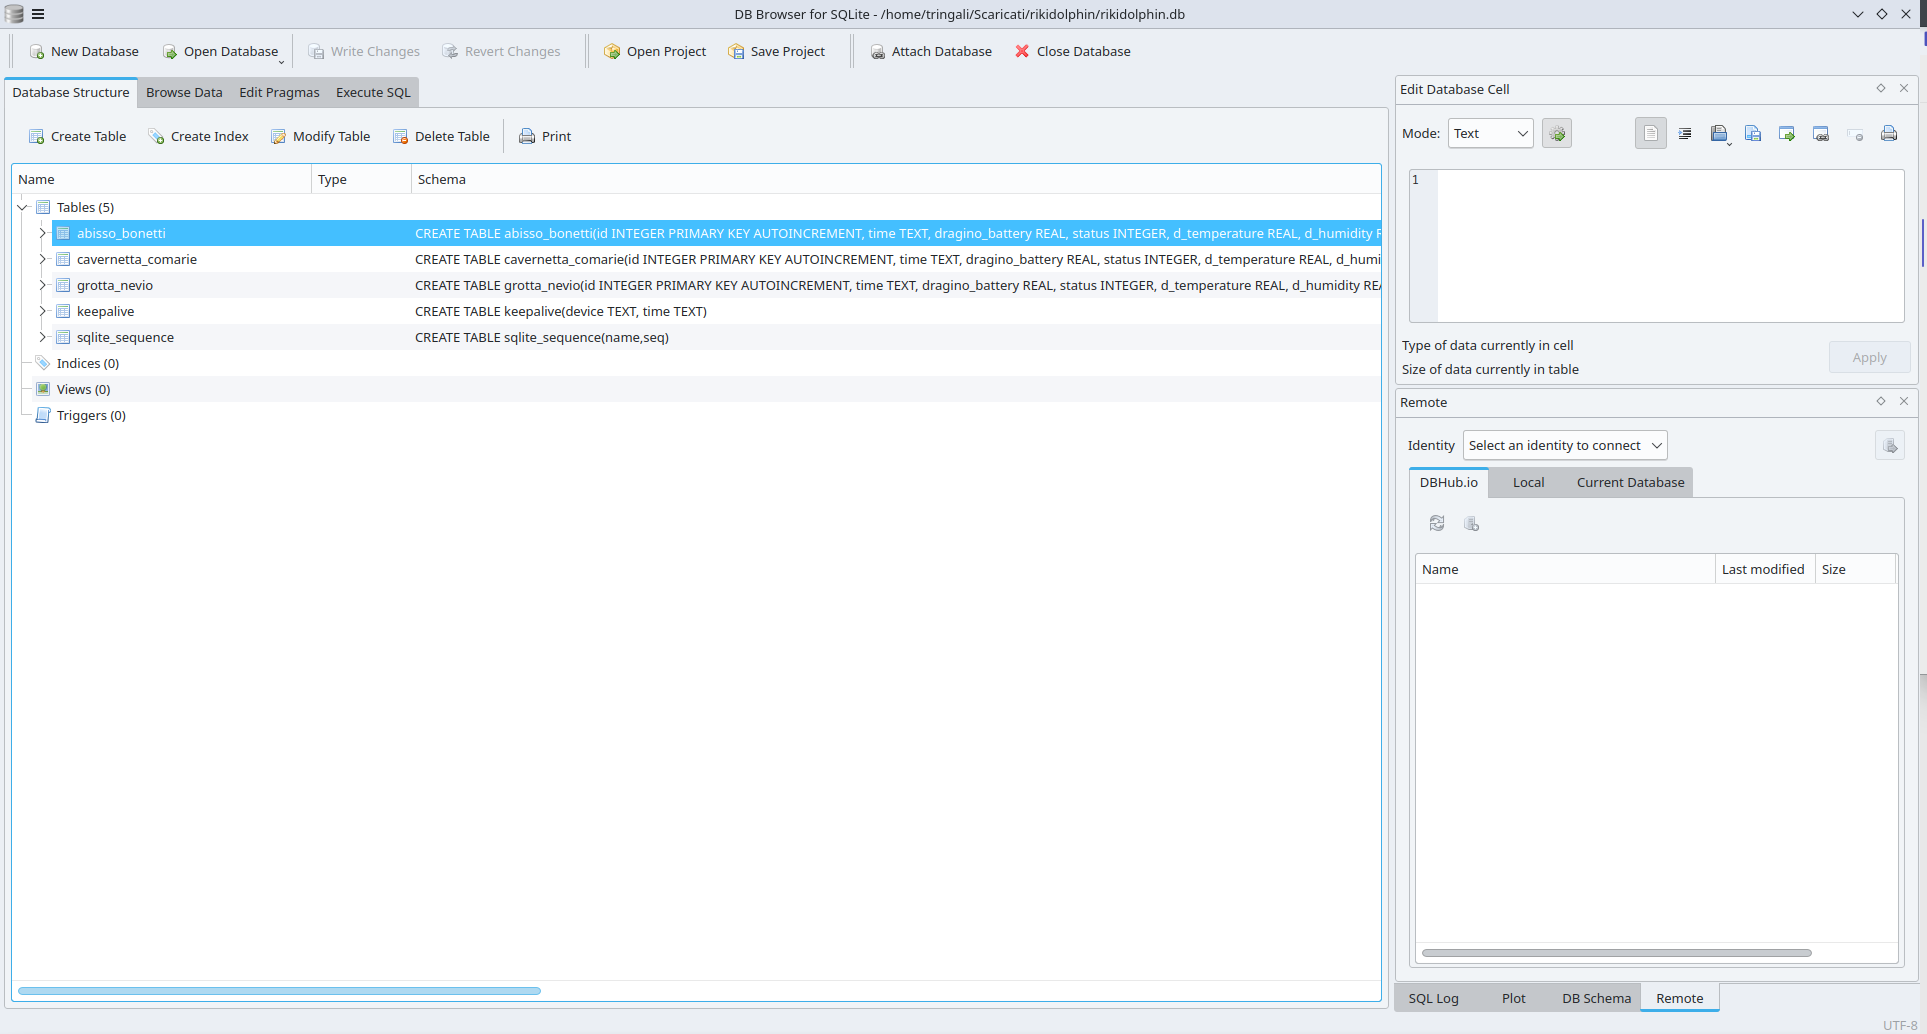
As soon as the database is loaded, the table structure is presented. The interface of SQLite Browser is built with tabs: they are Database Structure, Browse Data, Edit Pragma, and Execute SQL.
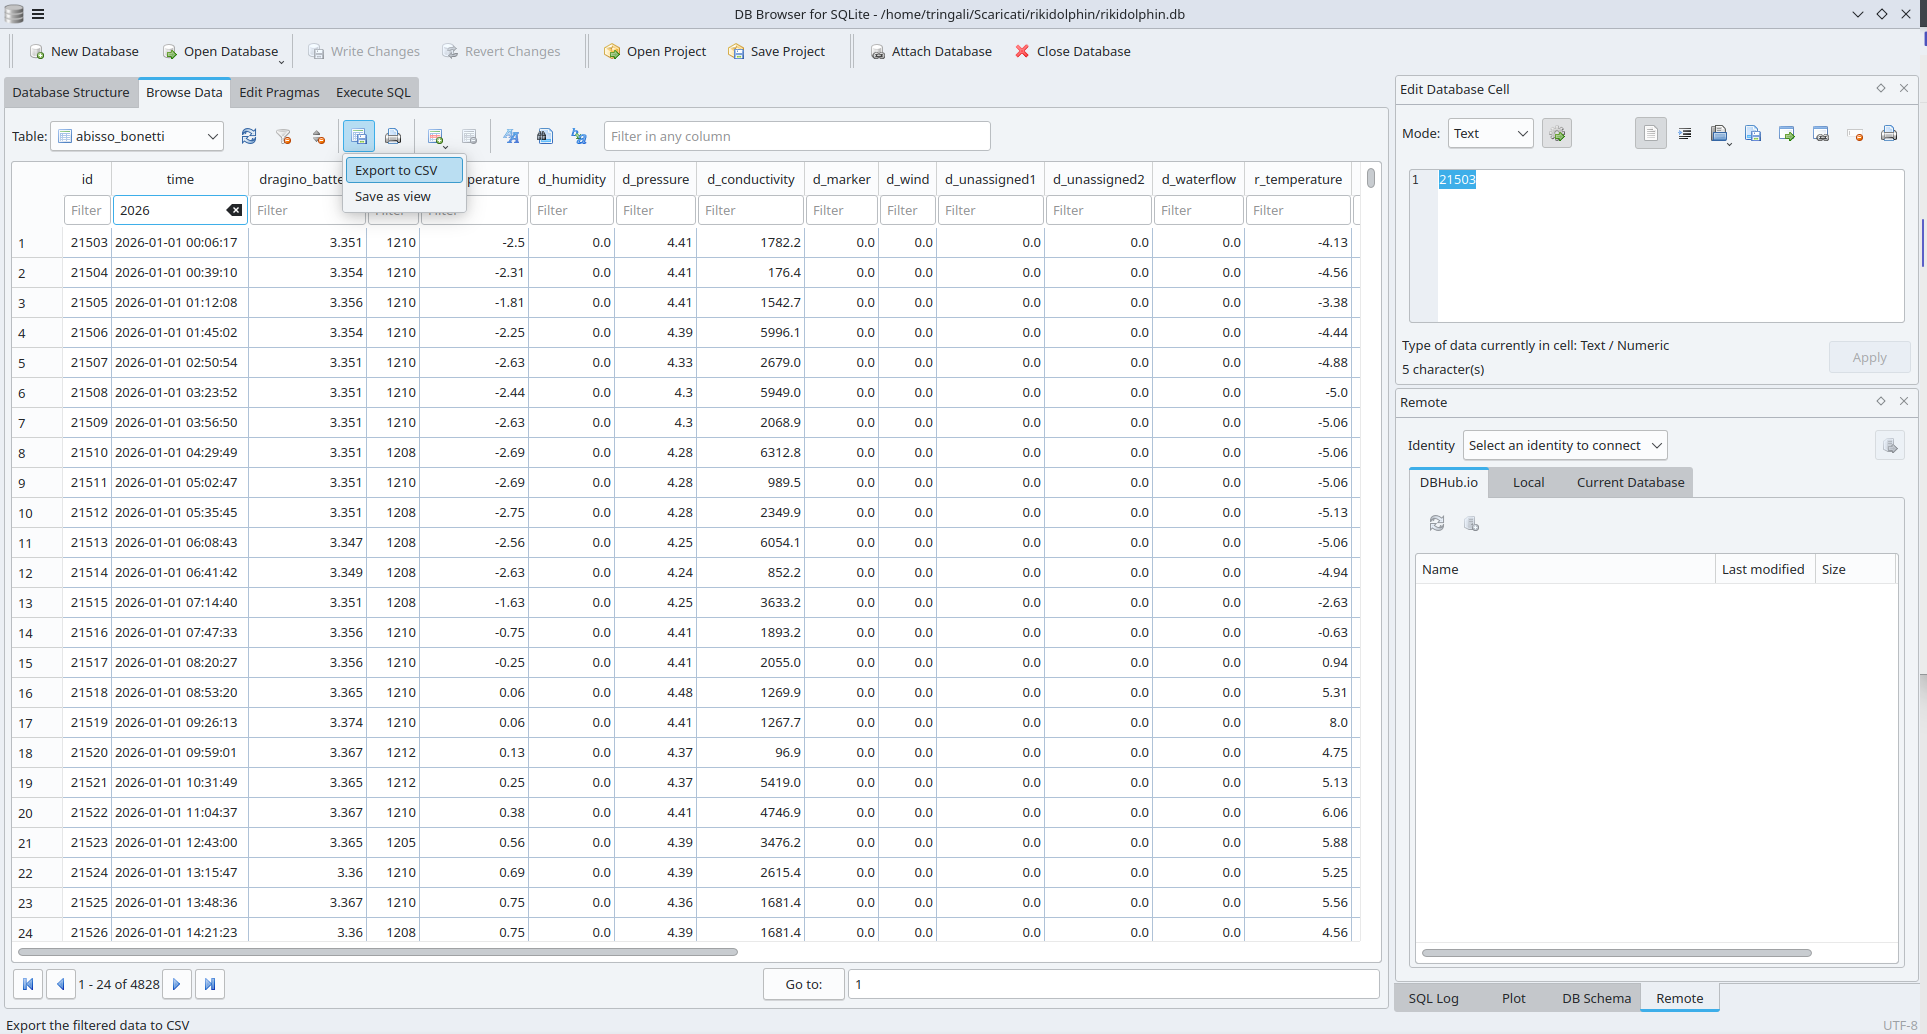
The first useful tab is Browse Data: it offers the option to just scroll through all the records in a single table. The table to view can be choosen using the dropdown menù, and it's possible to filter results using the text boxes (one for each column). It's also possible to edit or delete records, but changes are not written to the database unless they are manually saved. It's also possible to export all data as a CSV, but it's not really recommended because it might produce a very big CSV file that would be complex to use: it's better to export data in CSV format only after applying a strict filter.
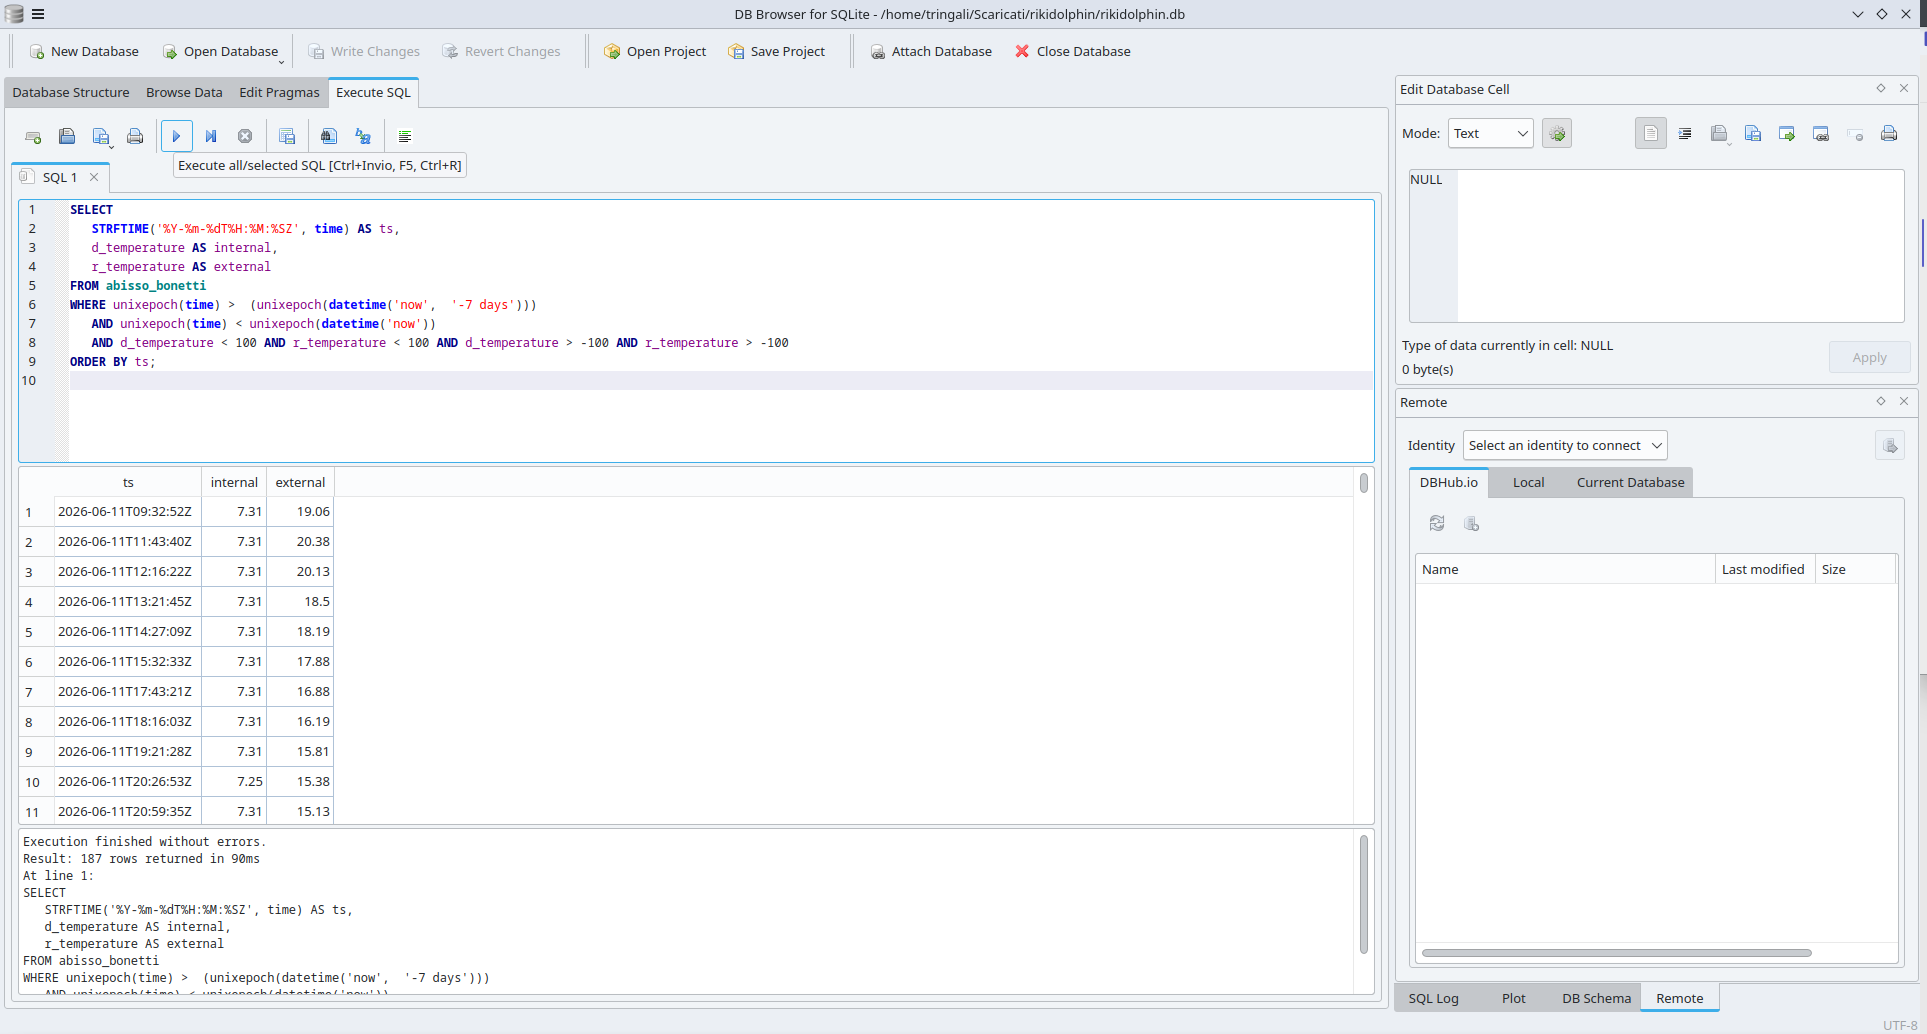
Another useful tab is Execute SQL: it allows for writing SQL queries and get the results. It is possible to simply enter into the SQL code area this basic query:
SELECT
  STRFTIME('%Y-%m-%dT%H:%M:%SZ', time) AS ts,
  d_temperature AS internal,
  r_temperature AS external
FROM abisso_bonetti
WHERE unixepoch(time) >  (unixepoch(datetime('now',  '-7 days')))
  AND unixepoch(time) < unixepoch(datetime('now'))
  AND d_temperature < 100 AND r_temperature < 100 AND d_temperature > -100 AND r_temperature > -100
ORDER BY ts;
to get the last 7 days data of both internal (d_temperature) and external (r_temperature) temperatures. To run the query it's just necessary to press the Execute button or press F5, and then the data will be presented in a read only table.
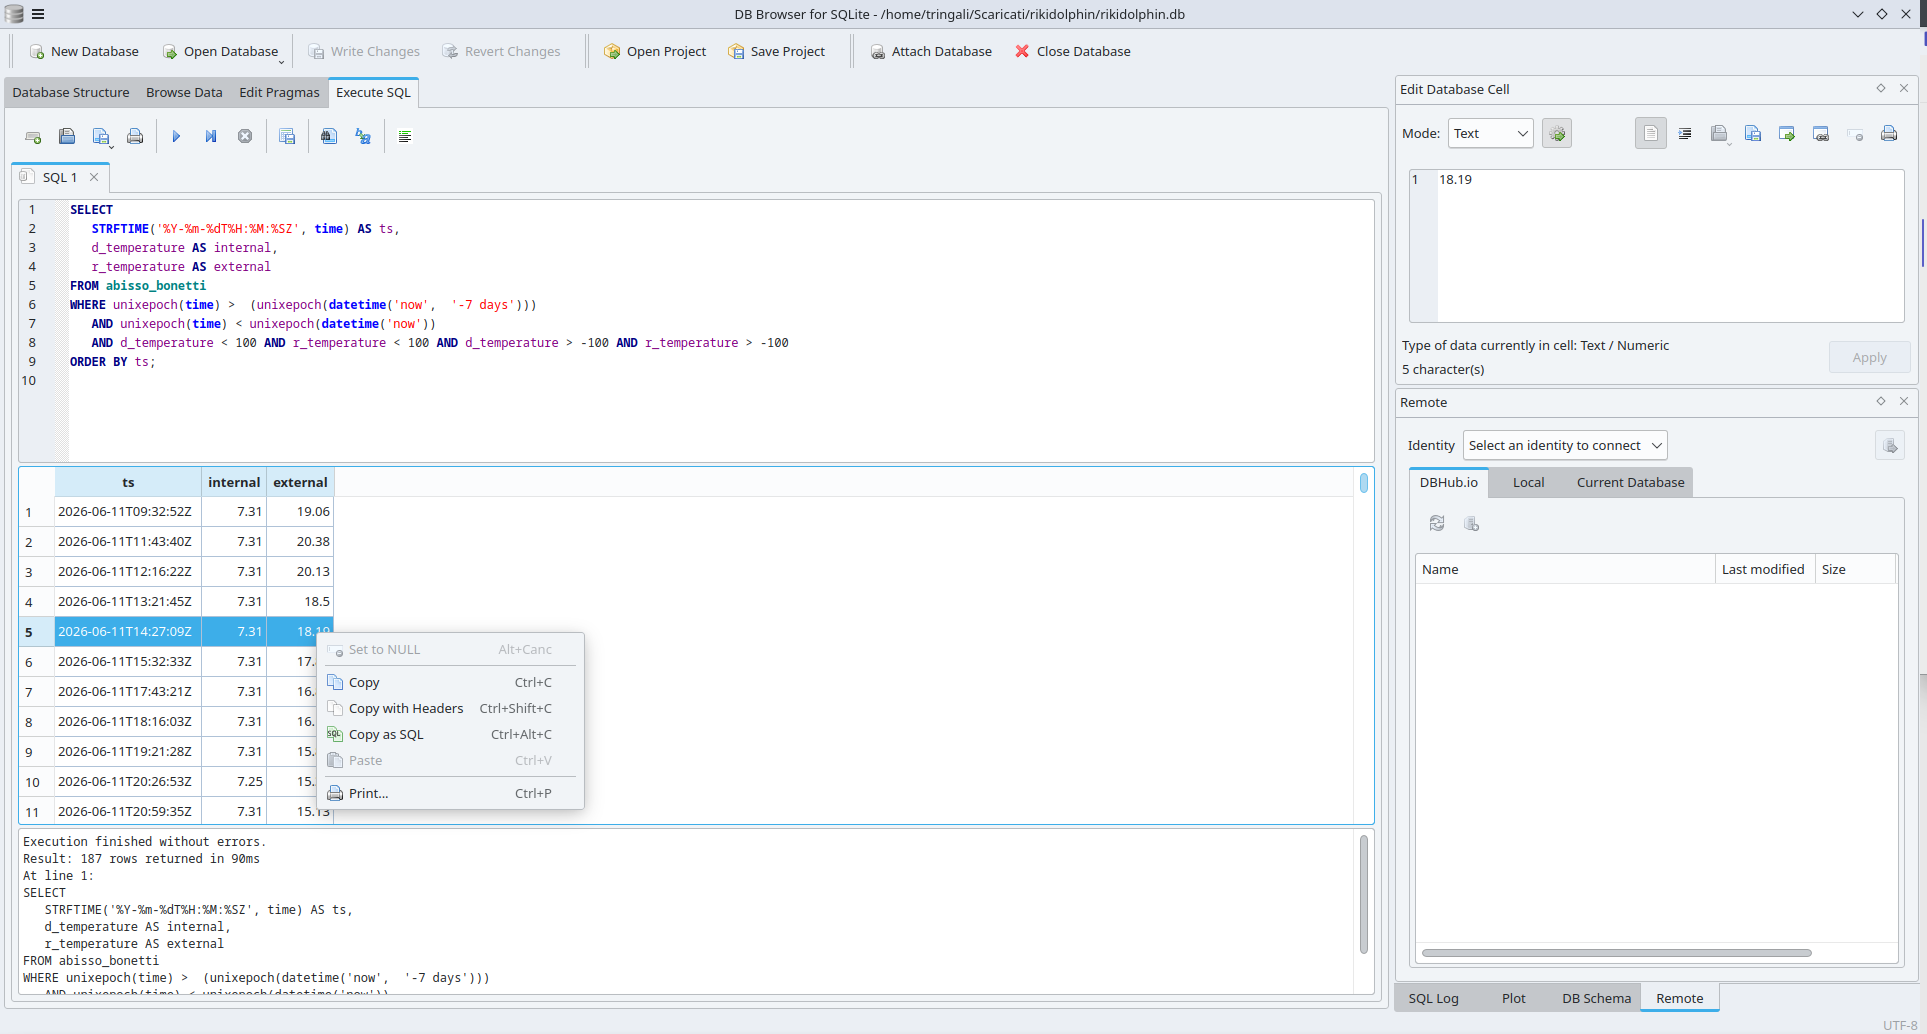
Data from the results can be quicly copied, with or without columns headers, to be pasted into every other software.
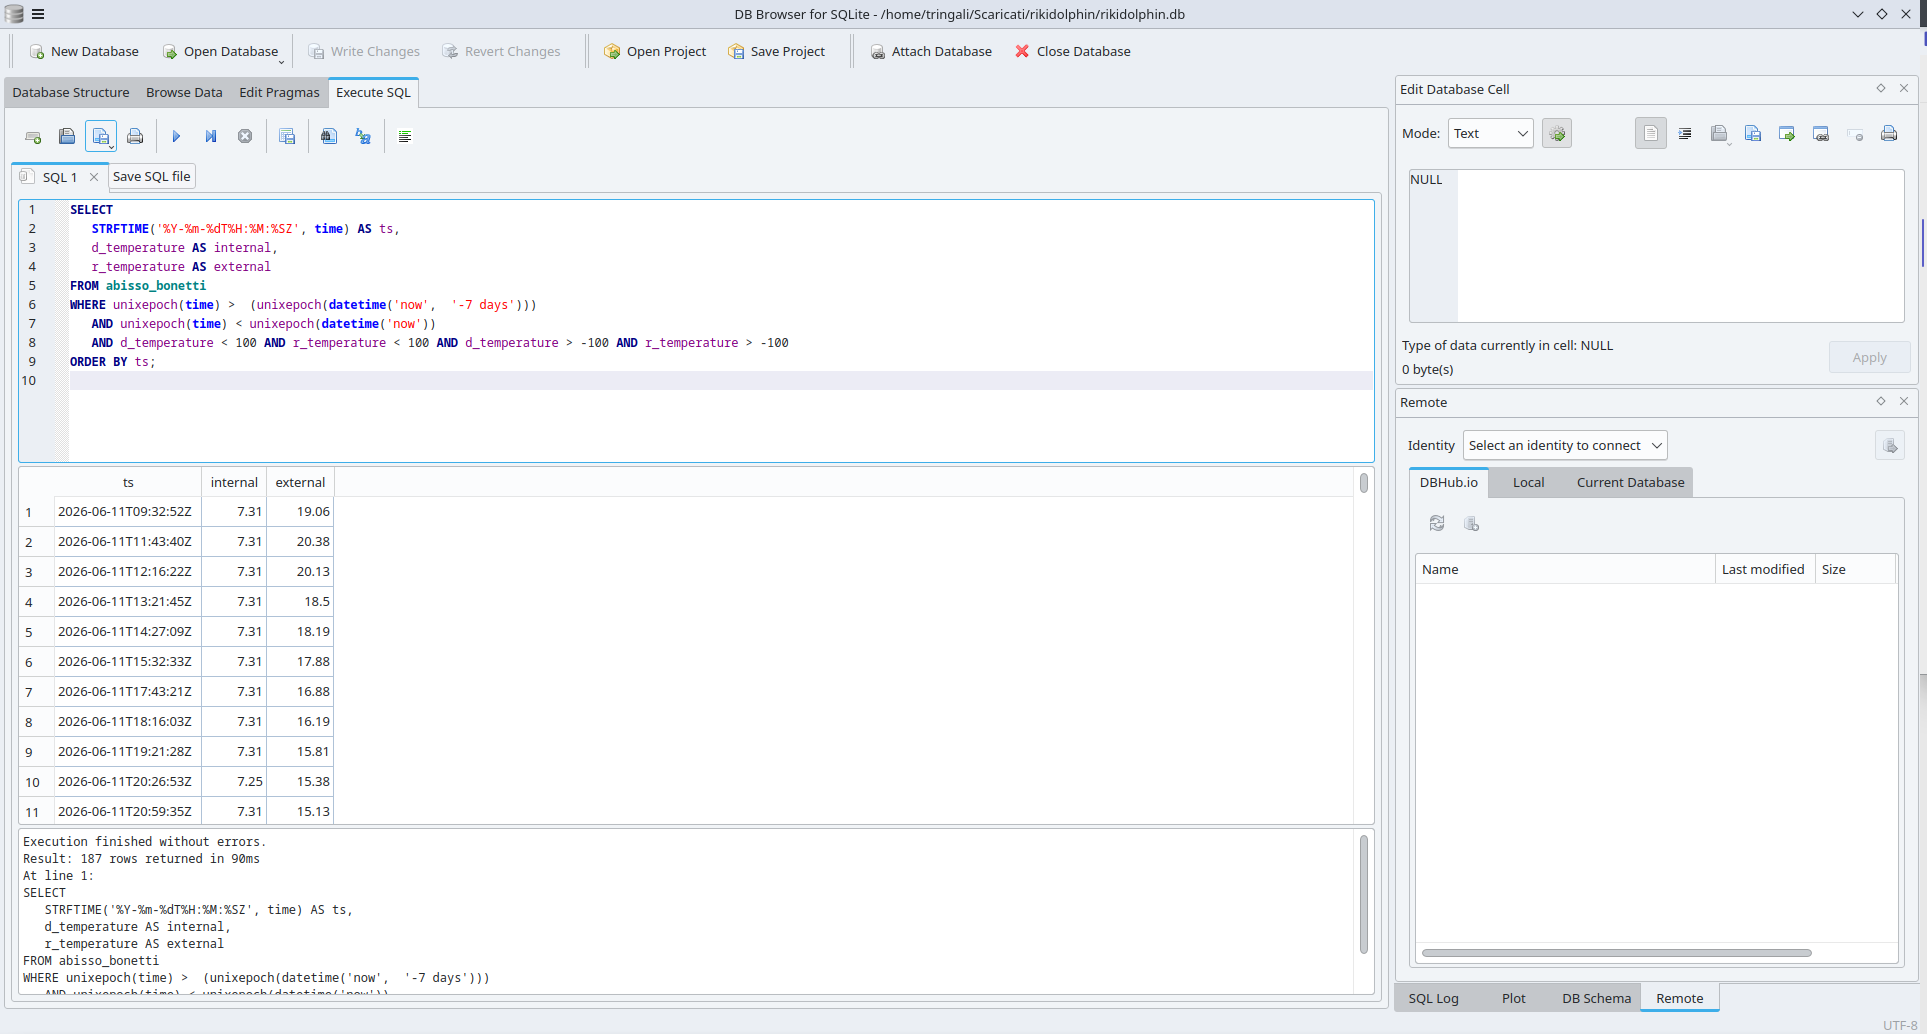
It's also possible to save queries as .sql files, in order to use them in the future. It's also possible to save the entire "project" witht he Save Project button. In SQLite Browser it is indeed possible to open multiple tabs for SQL queries and memorize them all, so the next time it will be possible to just load all the most useful queries and run them again.
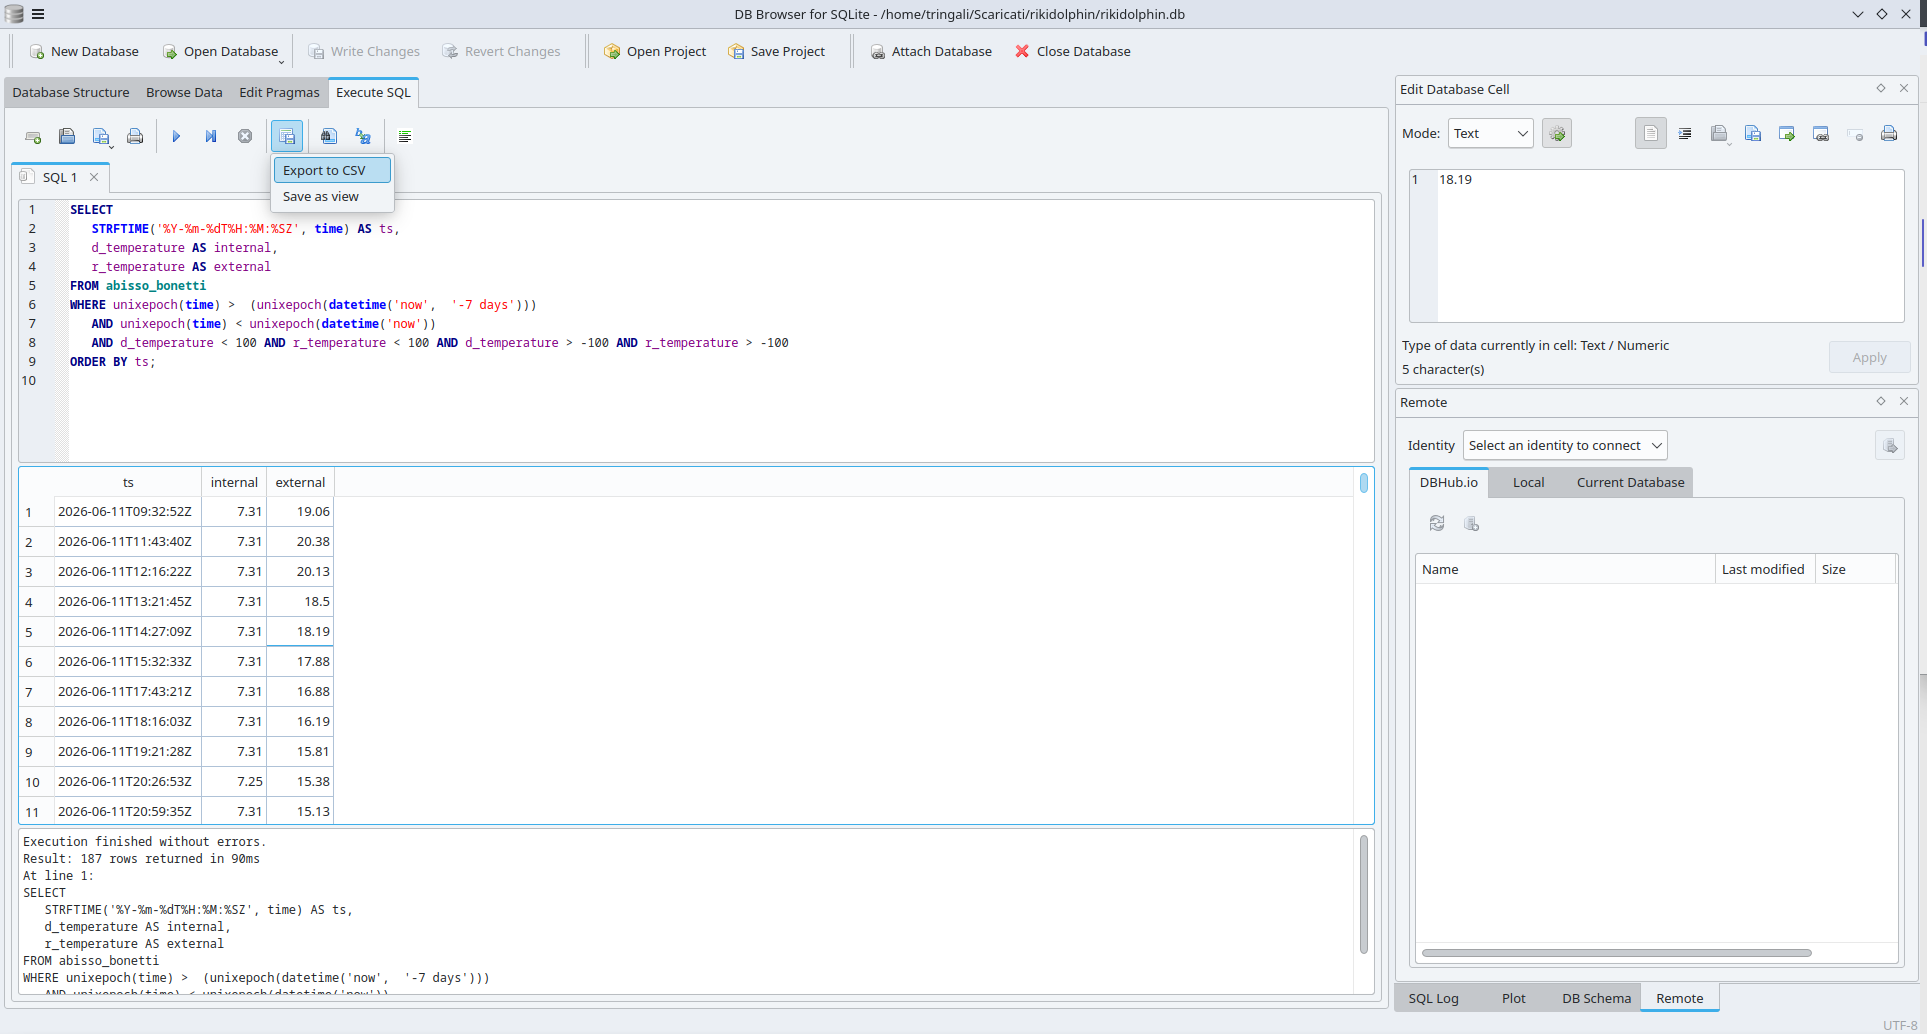
It's also possible to export the query results as CSV, which can be really useful to load these data into other software to draw plots, print reports, or run other statistics.
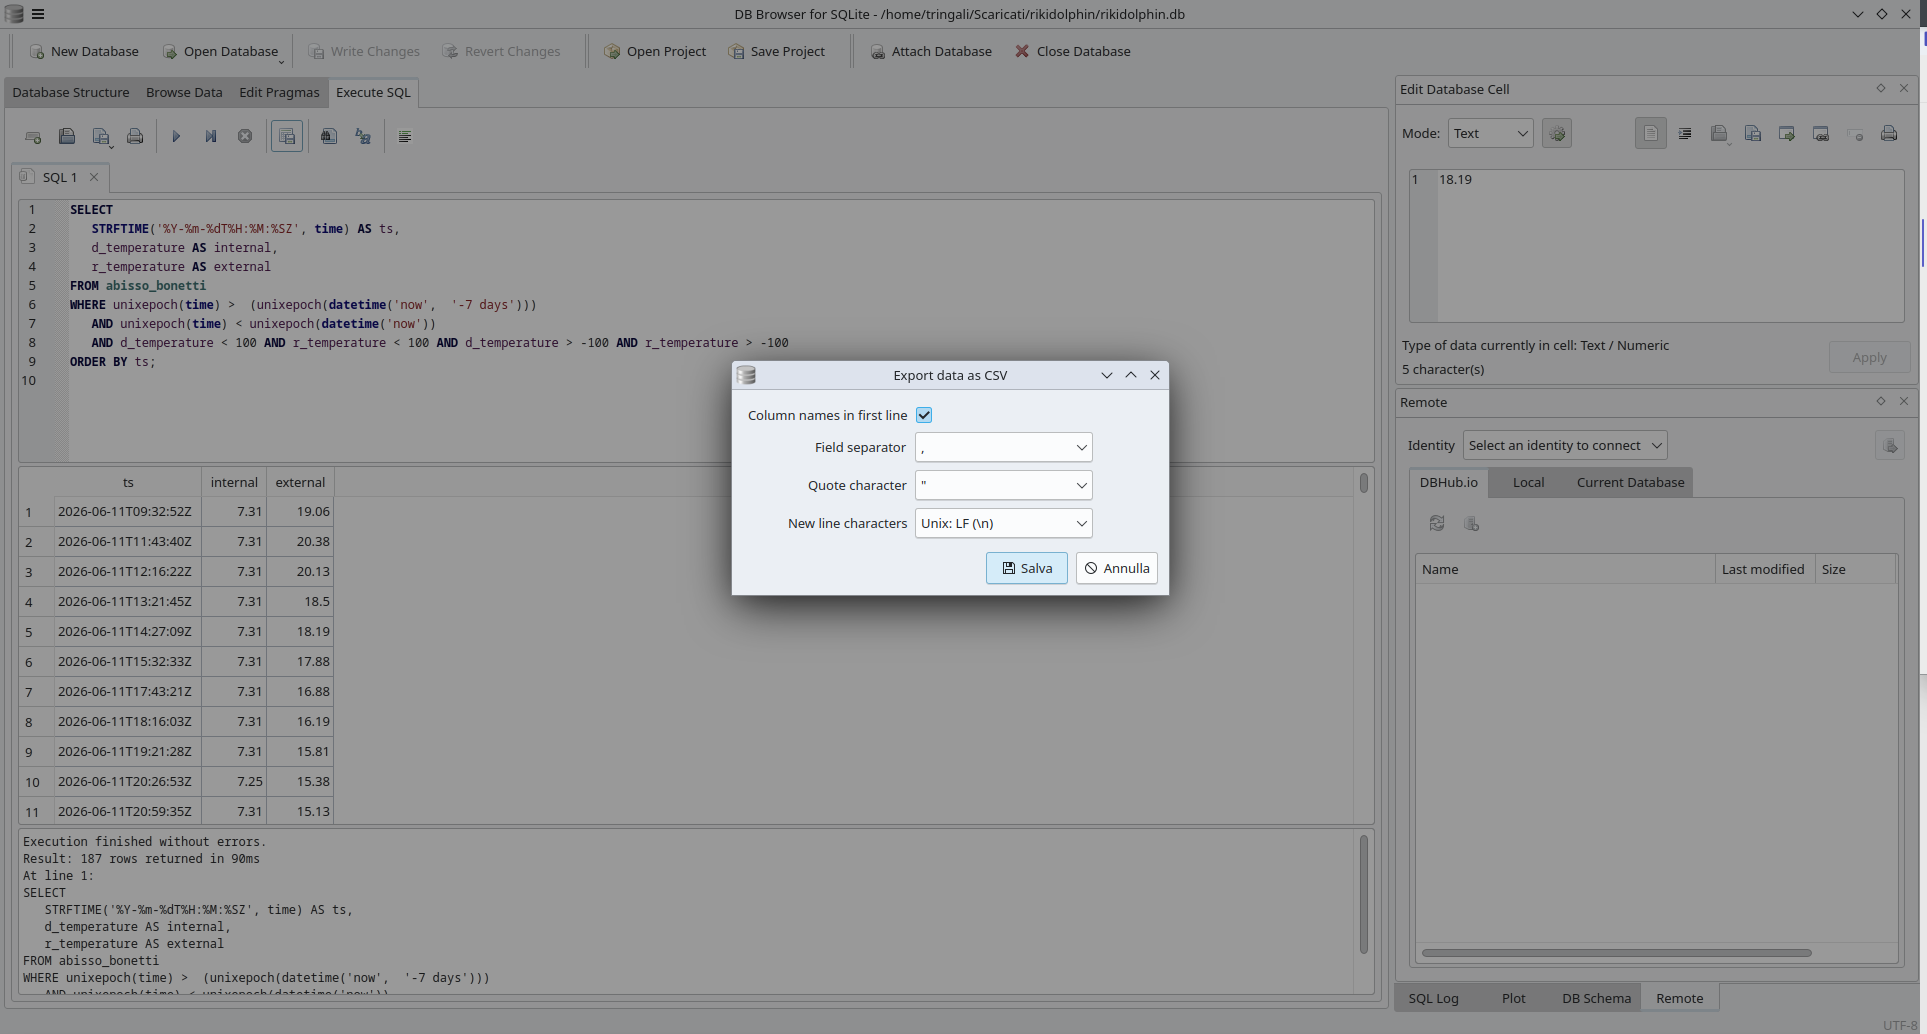
While exporting data as a CSV, it's possible to choose a few settings: the defaults usually work just fine for the vast majority of use cases. It's always a good option to have column names in the first line, and use a standard comma as a field separator.
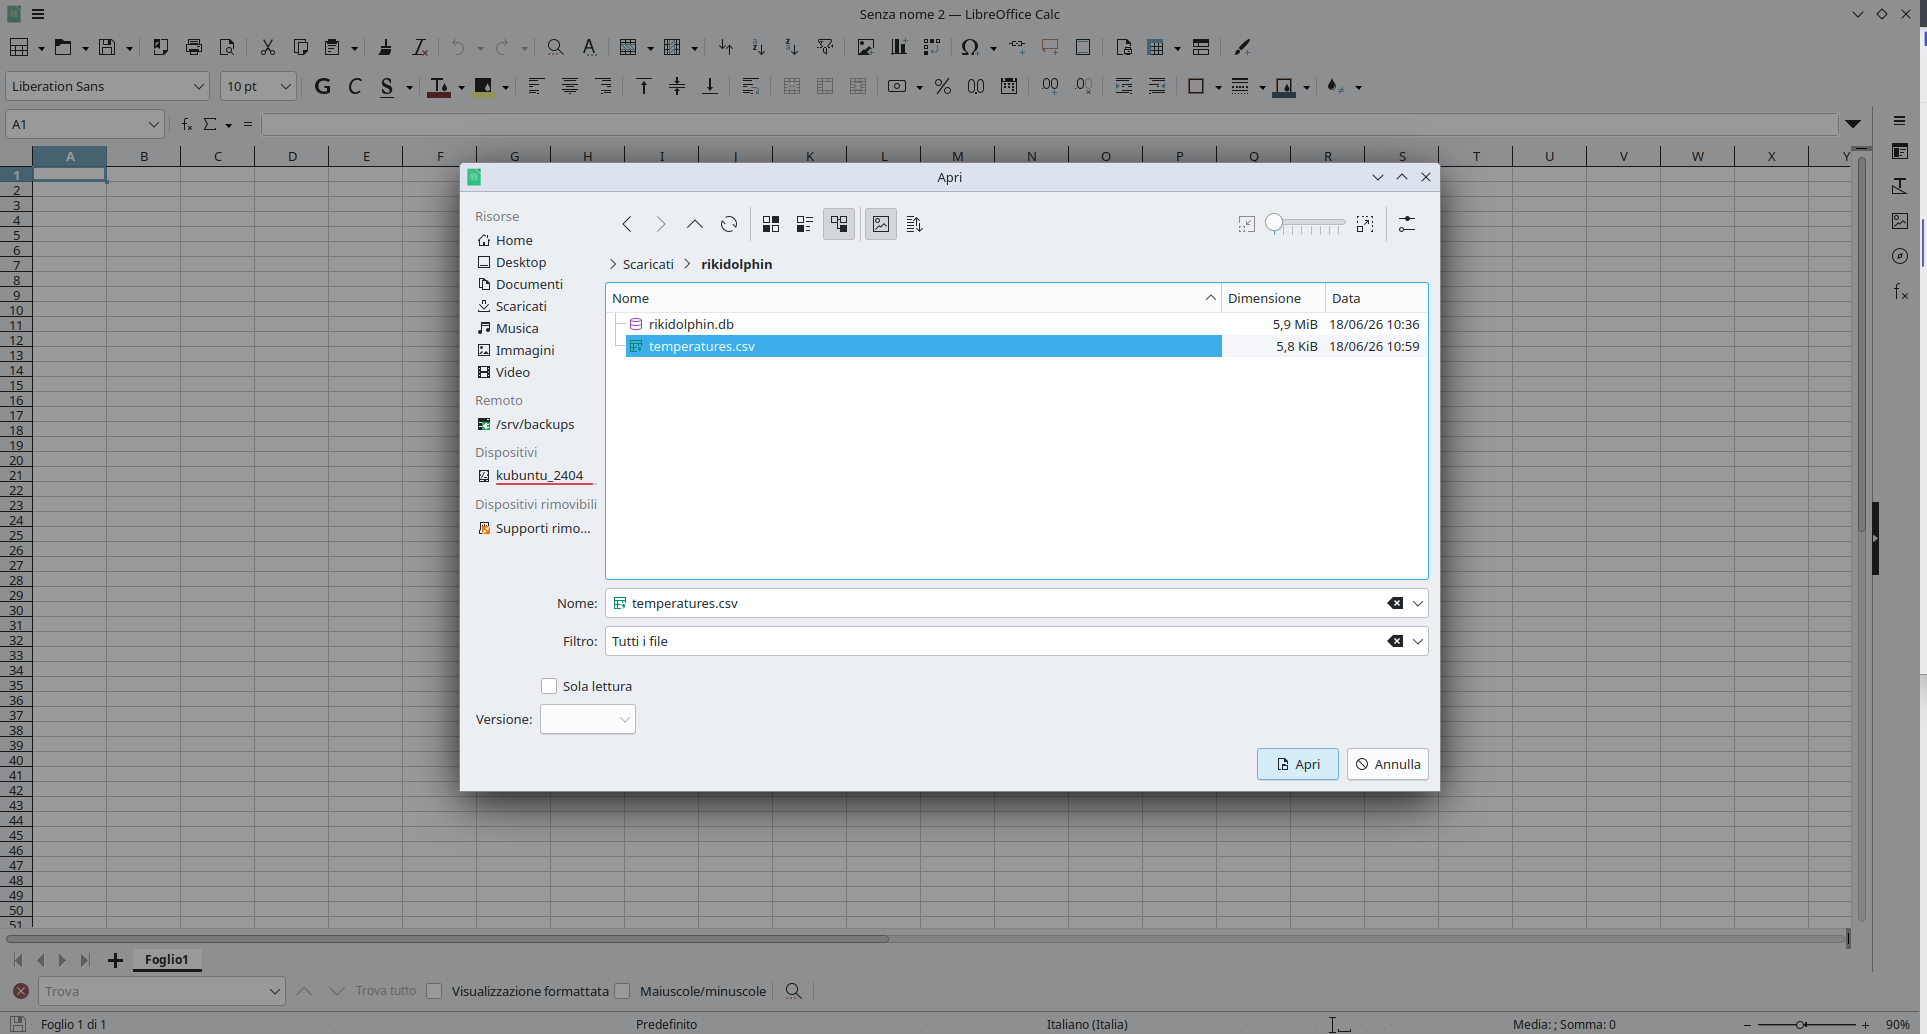
One good option to open a CSV file is LibreOffice Calc (or any other spreadsheet application).
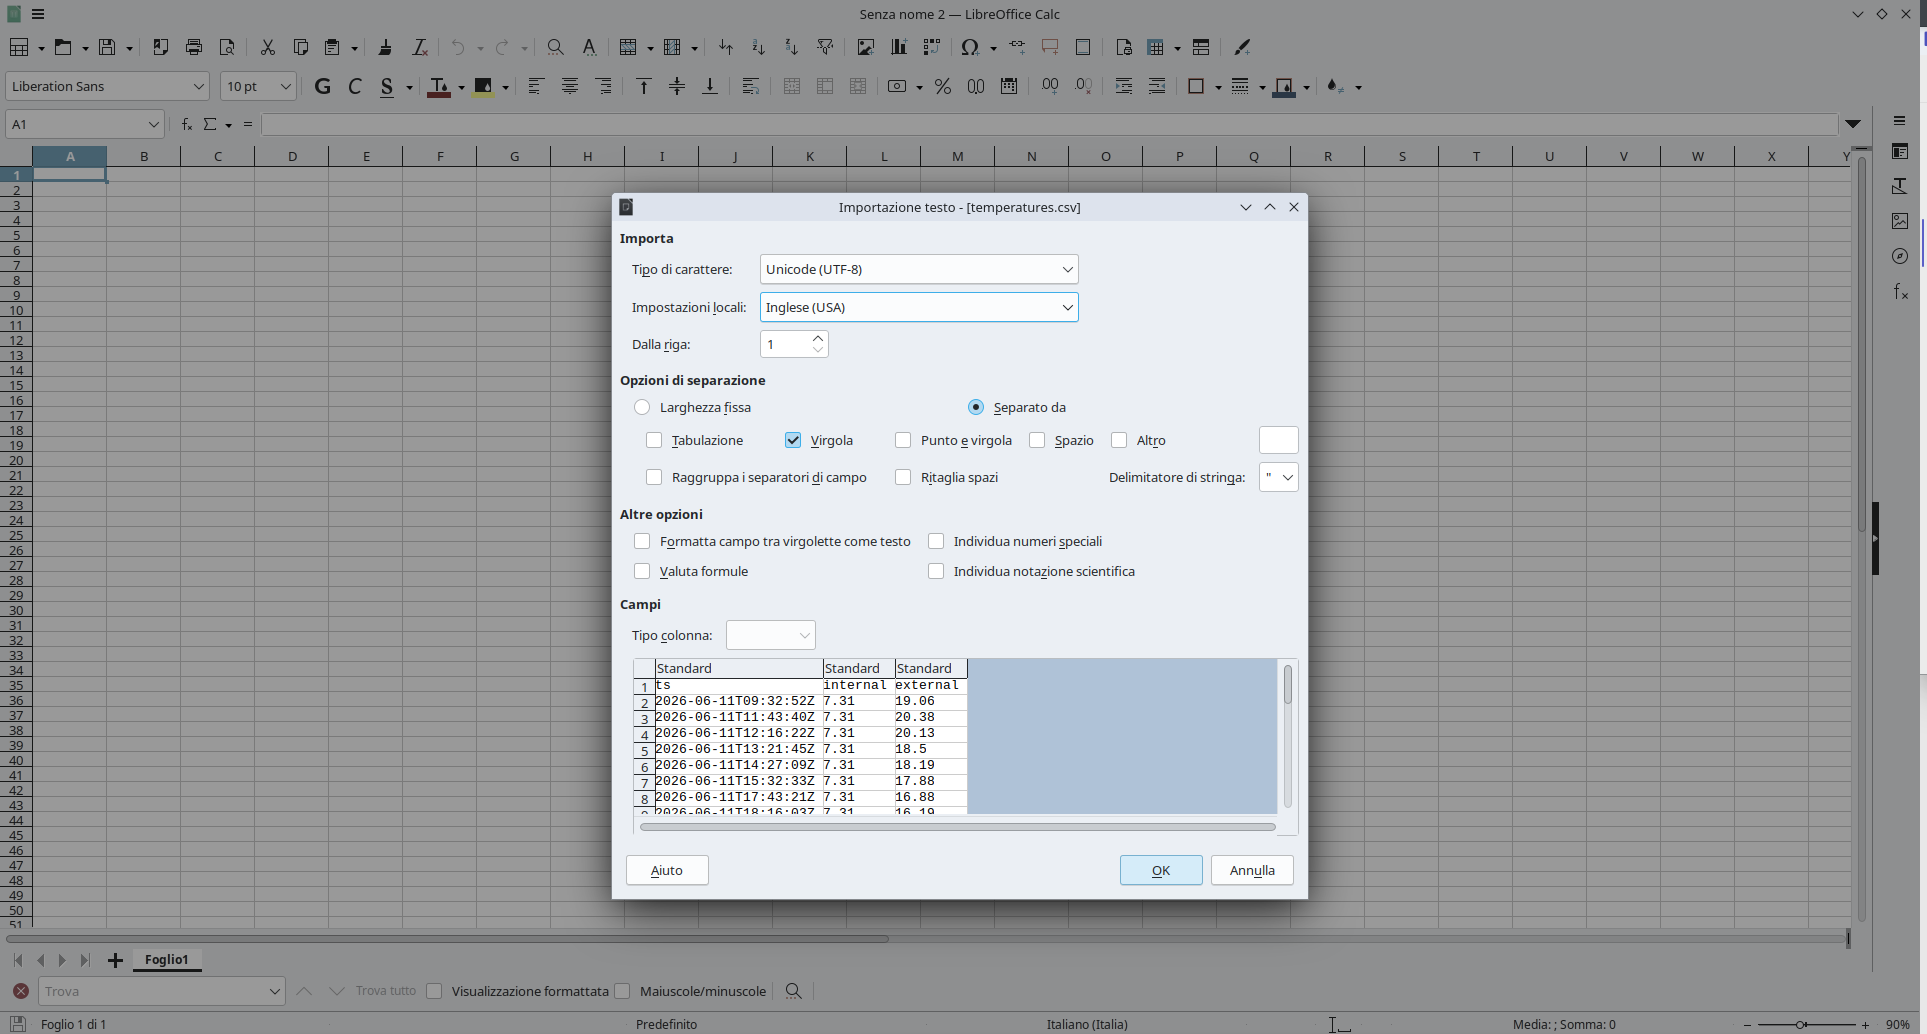
When loading the CSV file into LibreOffice Calc, the wizard offers a few options: it's important to select the comma as a separator, and the language as English (US), otherwise the floating point numbers might not get recognized correctly (in other languages the dot is not recognized as the decimal separator).
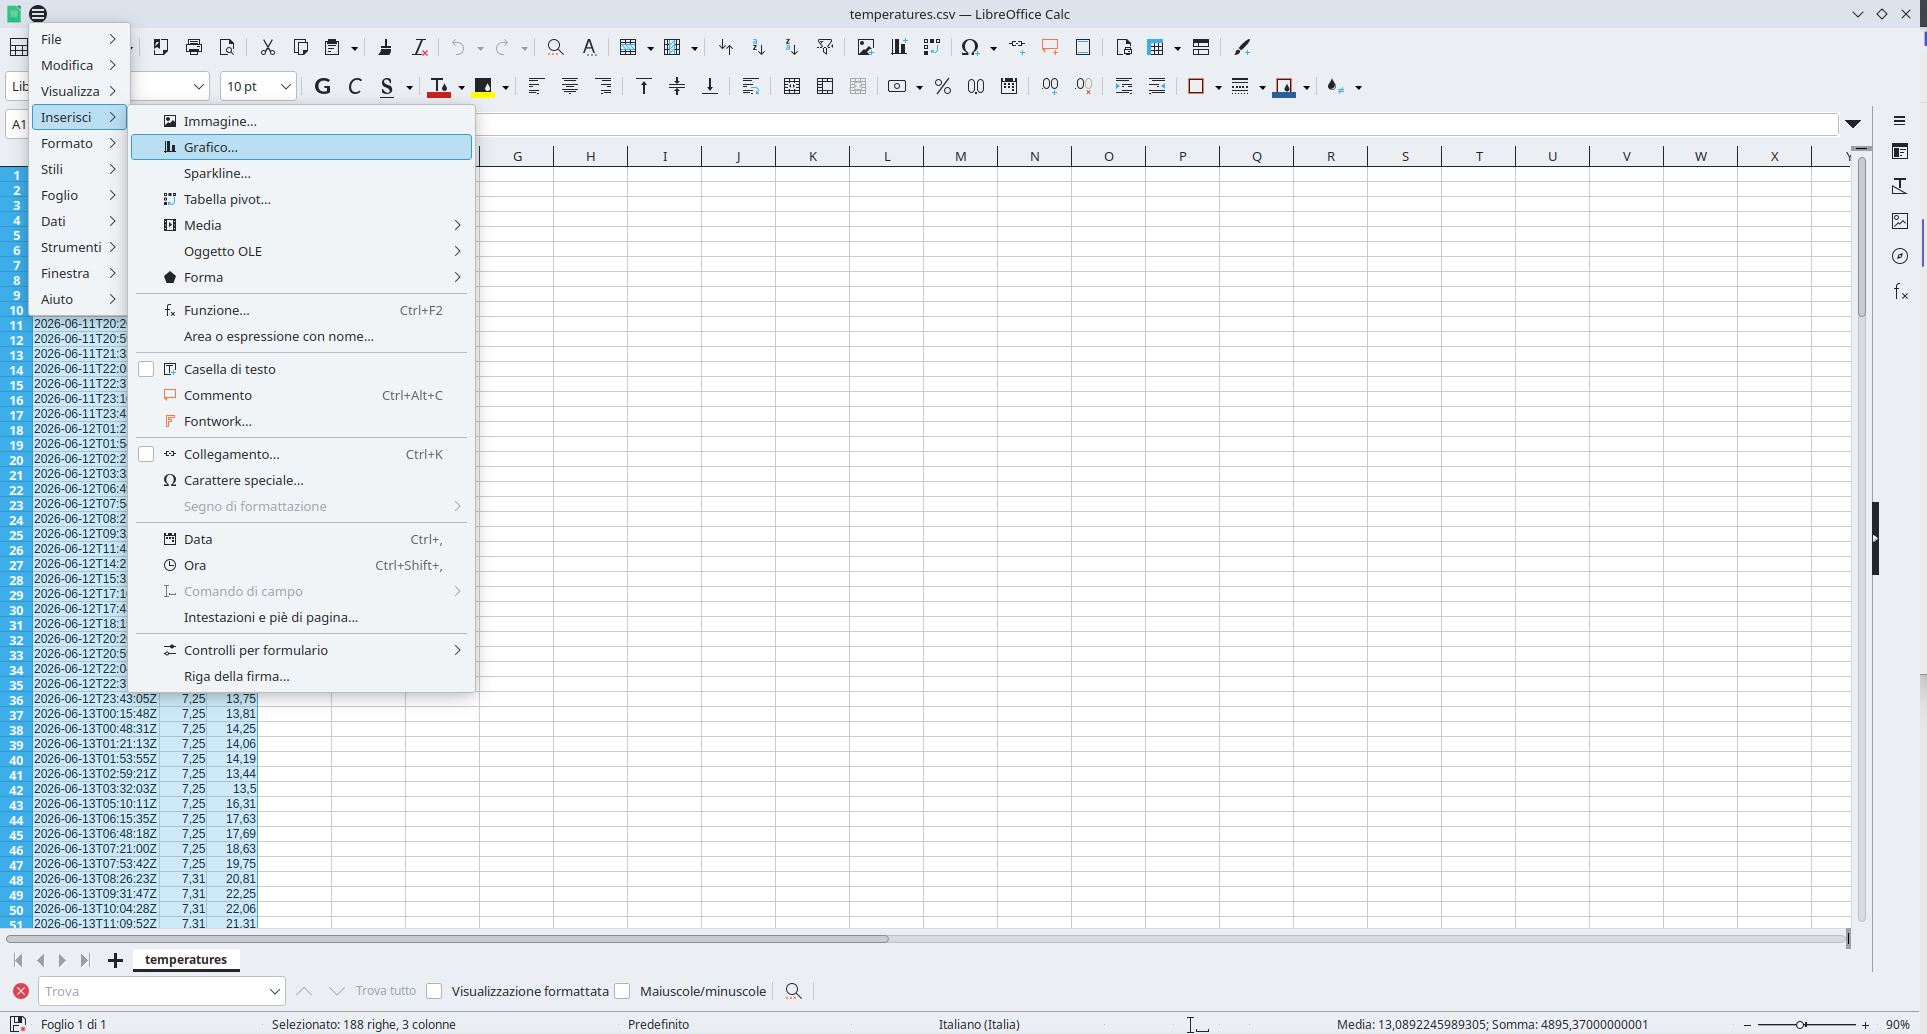
Once all the data has been loaded into Calc, they can be manipulated like in any other spreadsheet. For example, it's possible to select the and create a simple plot using the menù Insert/Plot.
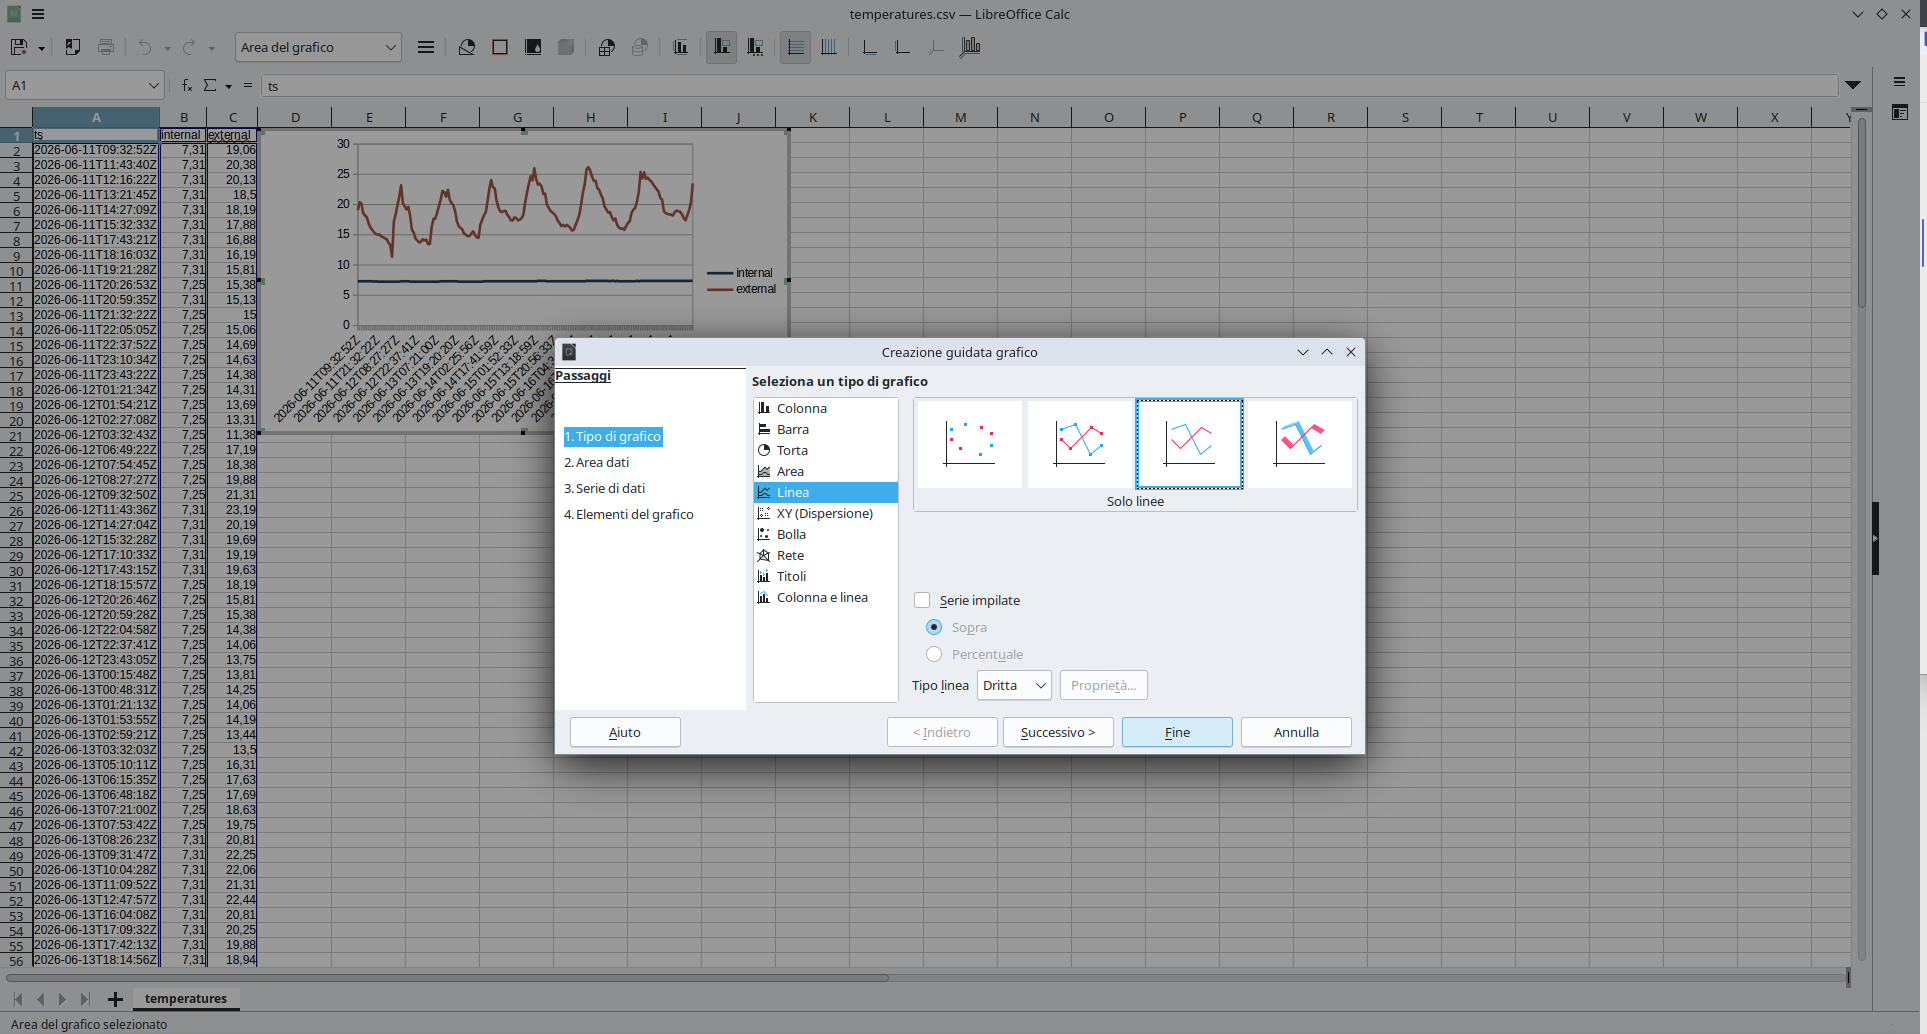
Usually, Calc automatically understands what columns to use as x-axis and which ones to plot on the y-axis, but it's possible to change them manually. Also, it's possible to select which kind of plot to draw, depending on the data: time series, usually, work fine with "lines" plot.
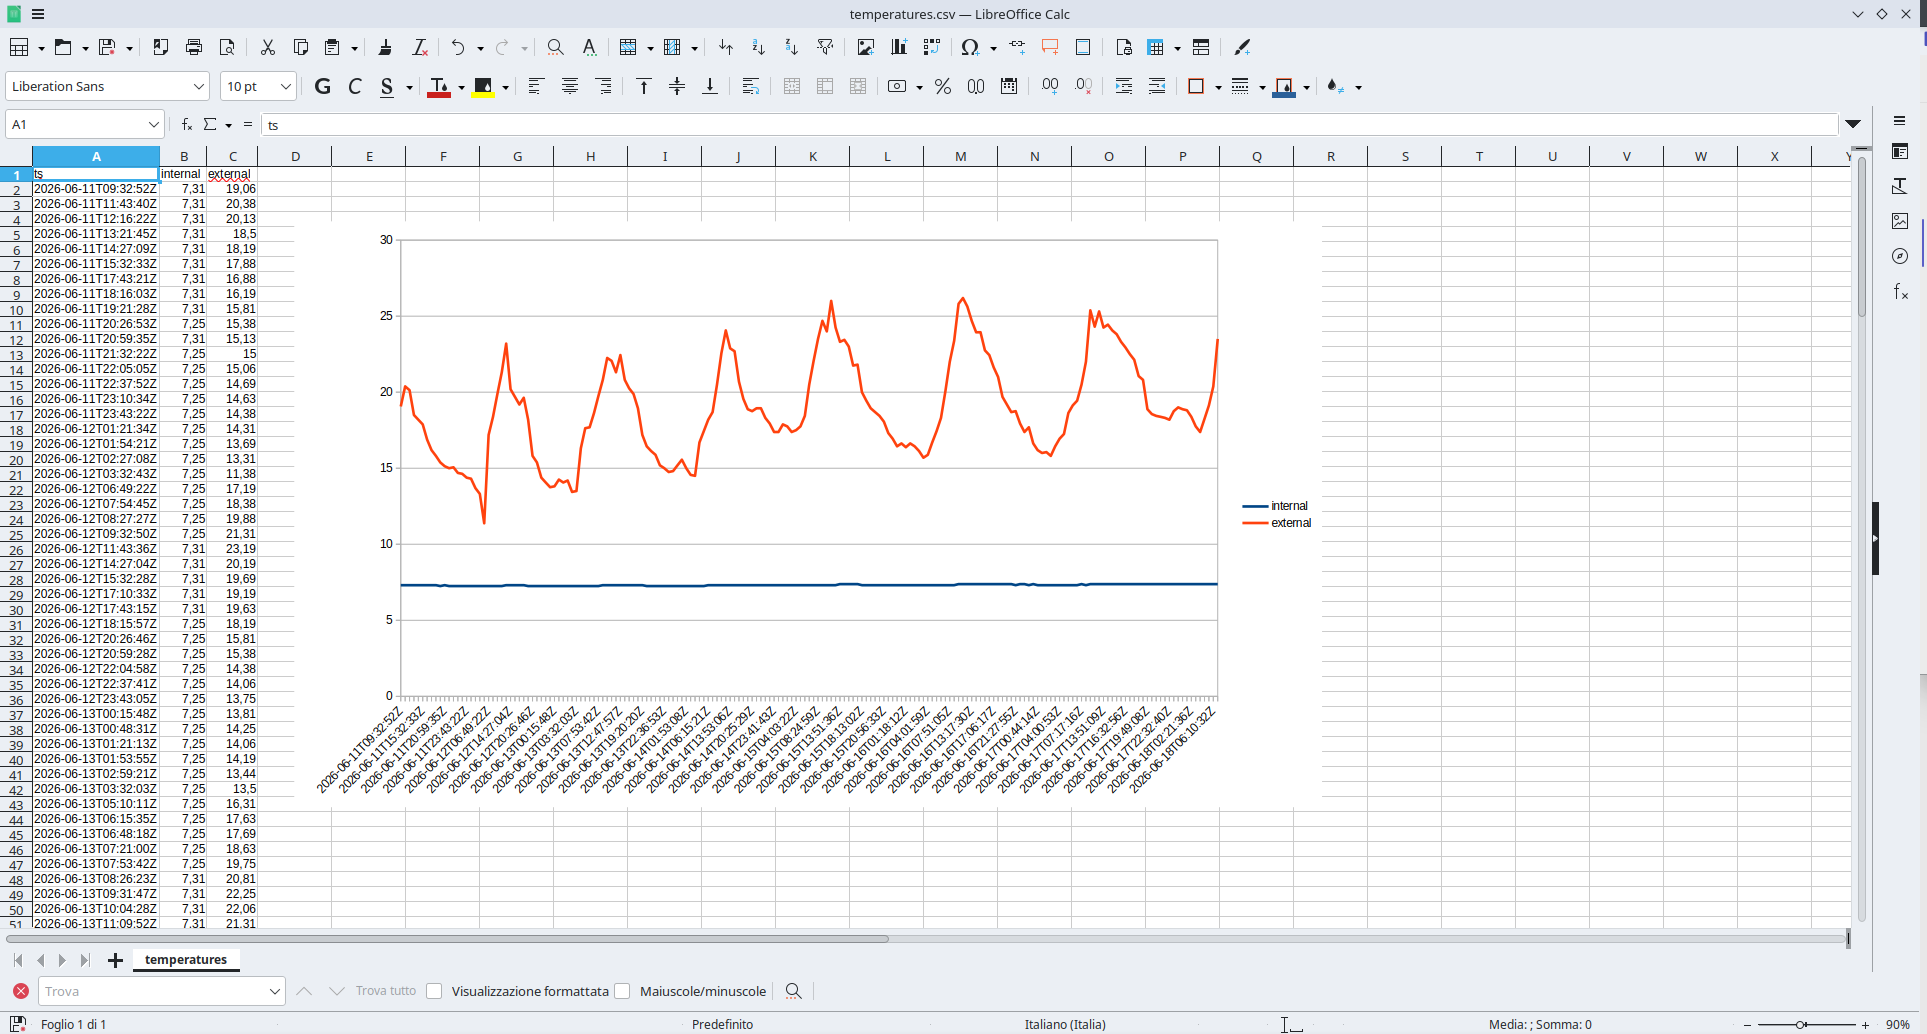
Plots are customizable (colors, labels, etc...), and can be exported as an image or directly included in docx documents or pptx slides for papers and other publications.
Of course, this procedure requires periodically downloading the database file and running the queries, but should be easy enough even for users that are not really tech savy. For real time plotting and analisys, Grafana is a better option.